
About Course
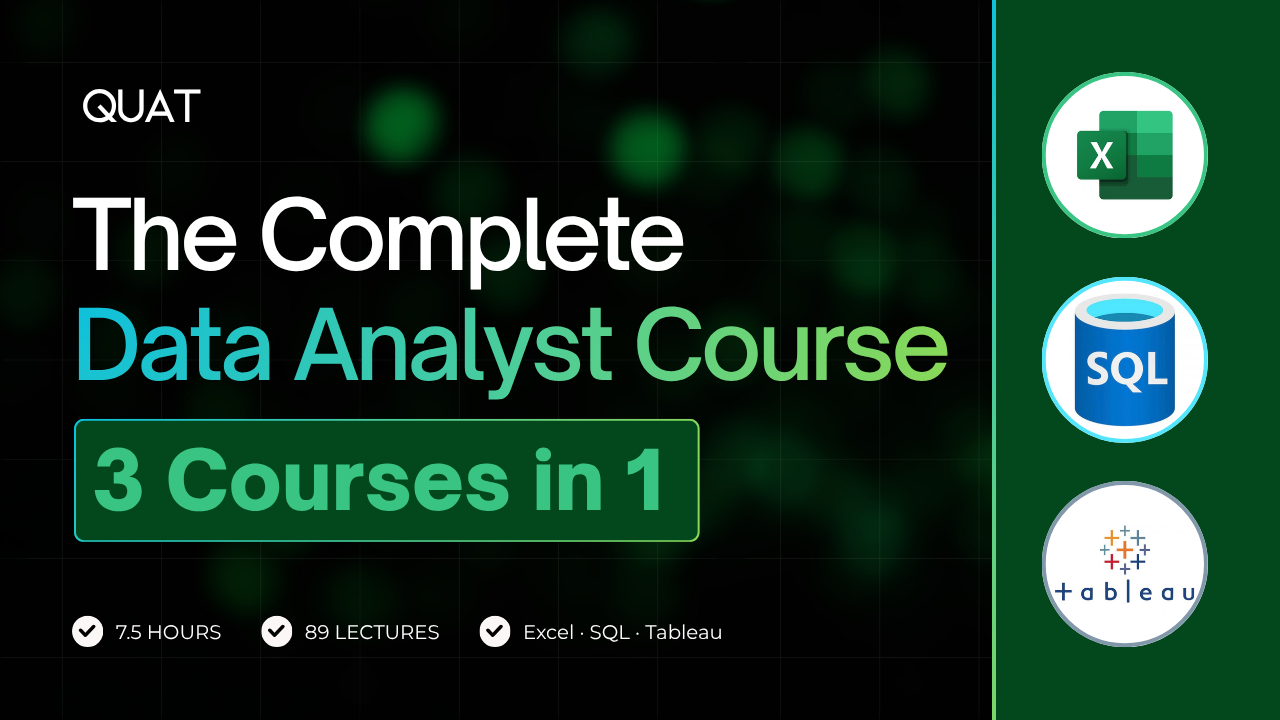
Learn Excel, SQL and Tableau in one course, using real messy business data, and finish with 3 projects you can put on your resume.
Most data analyst courses teach you formulas. This one teaches you the job.
You will join a fictional e-commerce company called ShopEasy on your first day, and you will be handed exactly what a real analyst gets handed: a broken spreadsheet. Duplicate orders. Product names spelled four different ways. Blank cells where the region should be. Nobody tells you what to do with it. That is the job, and by the end of this course you will know how to handle it in all three tools that employers actually ask for.
Why this course is different
There is no theory chapter you have to sit through before you touch data. You open the messy file in the first 10 minutes and start cleaning it. Every single lesson answers a real business question that a real CEO would ask, such as which region makes us the most money, why customers are returning products, and who our top salesperson actually is.
You use one connected dataset the whole way through. The same 200 orders you clean in Excel become the database you query in SQL and the dashboard you build in Tableau. You are not learning three unrelated tools. You are following one business problem across the full analyst workflow, which is exactly how the work happens in a real job.
What you will learn
Excel for data analysis
Clean genuinely dirty data with Remove Duplicates, PROPER, TRIM and the Filter plus Ctrl+Enter trick that fills blank cells in seconds. Connect two tables with VLOOKUP and understand all 4 arguments instead of memorising them. Answer business questions with COUNTIF, SUMIF, SUMIFS and IF. Build Pivot Tables that answer 5 questions without writing a formula. Then build a complete sales dashboard with KPI cards, summary tables and the right chart for each question.
SQL for data analysis
Start querying in your browser with DB Fiddle, so there is nothing to install. Master SELECT, WHERE, AND, OR, ORDER BY and LIMIT. Summarise data with COUNT, SUM, AVG and GROUP BY, then learn HAVING and why it is not the same as WHERE, which is one of the most common SQL interview questions there is. Connect tables with INNER JOIN and LEFT JOIN, and understand why a JOIN is just VLOOKUP with different syntax. Then answer 10 real SQL interview questions, including return rate per product, average revenue per customer and finding orders above average revenue with a subquery.
Tableau for dashboards
Install Tableau Public for free and connect 3 tables using Relationships, with no JOIN to write. Fix the numbers Tableau wrongly reads as text, which is the single most common thing that stops beginners cold. Build bar, pie and line charts and learn when each one is the right choice and when it lies. Create KPI cards with the Marks card, Count Distinct and Measure averages. Then build a full interactive dashboard with cross filtering and publish it to the web with a live URL you can send to a recruiter.
AI as an analyst tool
You will also use AI the way working analysts now use it, to validate cleaned data and catch the mistakes you missed, rather than to do the thinking for you.
The 3 projects you will finish with
- A sales dashboard in Excel with 4 KPI cards, 3 summary tables and 3 charts
- 10 SQL interview questions answered and documented, which doubles as your revision sheet before an interview
- A published interactive Tableau dashboard with a live public URL for your resume and LinkedIn
These are not exercises you throw away. They are 3 portfolio pieces, and the Tableau dashboard is a link you can put directly in a job application.
Who this course is for
Complete beginners who have never written a formula or a query. Students and graduates who want a data skill that gets interviews. Working professionals in sales, marketing, operations or finance who are tired of waiting on someone else to pull their numbers. Anyone who has finished a theory heavy course and still cannot open a real file and know what to do. Career switchers who need portfolio projects, not just certificates.
Requirements
No prior experience with Excel, SQL or Tableau. No maths or statistics background. No coding background. Any computer with Excel or Google Sheets, plus a browser. SQL runs in your browser at DB Fiddle and Tableau Public is free, so there is nothing to buy and nothing complicated to install. All datasets are included and downloadable.
What you get
7.5 hours of on demand video across 89 lectures and 18 sections. 3 real world projects. 3 downloadable datasets. Full lifetime access. Access on mobile and TV. Certificate of completion.
Enrol now, open the messy file, and start doing the actual work of a data analyst today.
Course Content
SECTION 1: Introduction
-
What Is a Data Analyst?
07:38 -
The 4 Types of Analysis
02:28 -
Types of Data
03:56 -
Structured vs Unstructured Data
01:01 -
The Data Family
06:02 -
How to Think Like a Data Analyst
04:27 -
Starting with Excel: Getting Your Data
03:41